Note
Go to the end to download the full example code
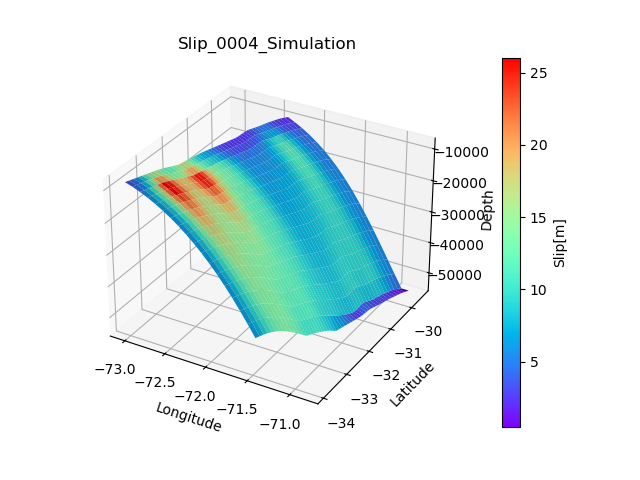
3D Slip Figure of a Stochastic generation
This example makes an 3d plot of Slip distribution :param X_array: Longitude grid :param Y_array: Latitude grid :param depth: Depth grid :param Slip: Slip grid :param filename: Optional, filename if you wanna save fig :return: 3D Figure of Slip distribution

import numpy as np
import matplotlib.pyplot as plt
import scipy.io
from matplotlib import cm
from matplotlib.ticker import LinearLocator
from matplotlib.colors import ListedColormap, Normalize
import geostochpy
def plot_3d(X_array,Y_array,depth,Slip,filename=None):

    fig = plt.figure()
    ax = fig.add_subplot(111, projection='3d')
    # Plot the surface with face colors taken from the array we made.
    surf = ax.plot_surface(X_array,Y_array, depth, facecolors=cm.rainbow(Slip/np.max(Slip.flatten())), linewidth=0)
    # Customize the z axis.
    # Agregar barra de colores con el rango correcto
    norm = plt.Normalize(np.min(Slip.flat), np.max(Slip.flat))
    sm = plt.cm.ScalarMappable(cmap=plt.cm.rainbow, norm=norm)
    sm.set_array([])  # este paso es necesario para que la barra de colores refleje correctamente los valores
    plt.title('Slip_0004_Simulation')
    # Configurar etiquetas
    ax.set_xlabel('Longitude')
    ax.set_ylabel('Latitude')
    ax.set_zlabel('Depth')
    cbar = fig.colorbar(sm, ax=ax, pad=0.1)
    cbar.set_label('Slip[m]')
    # Configurar posición de la barra de colores
    cbar.ax.yaxis.set_label_position('right')  # Puedes ajustar la posición según tus necesidades
    if filename!=None:
        fig.savefig(filename)
    return plt.show()


nx=18
ny=50
width=180
length=500
dx=width/nx
dy=length/ny

# Primero, se cargarán lo datos del trench de Chile, para realizar una geometría paralela a ella
#
# También, se cargarán los archivos de Slab2, que contienen los parámetros geométricos de la zona de subducción de Sudamérica

# In[3]:


route_trench = geostochpy.get_data('trench-chile.txt') # route to trench file
lons_fosa, lats_fosa  = geostochpy.load_trench(route_trench)
# load slab files
slabdep,slabdip,slabstrike,slabrake=geostochpy.load_files_slab2(zone='south_america',rake=True)


# Se realiza la falla a lo largo del trench, y se le da el valor más al norte de la falla.
#
# Luego, se deben tener las profundidades en cada subfalla, para ello se interpolan los datos de Slab2 con geostochpy.interp_slabtofault

# In[4]:


north=-29.5
lons,lons_ep,lats,lats_ep=geostochpy.make_fault_alongtrench(lons_fosa,lats_fosa,north, nx,ny,width,length)
[X_grid,Y_grid,dep,dip,strike,rake]=geostochpy.interp_slabtofault(lons,lats,nx,ny,slabdep,slabdip,slabstrike,slabrake)


# ##### Se crea la matriz de slips medios con geostochpy.matriz_media(mean,dep)

# In[15]:
#
## Creation slip models
# mean matrix
#
Mw=9.0
media,rigidez=geostochpy.media_slip(Mw,dx*1000,dy*1000,dep)
leveque_taper=geostochpy.taper_LeVeque(dep,55000)
# leveque_taper=leveque_taper/np.max(leveque_taper)
villarroel_taper=geostochpy.taper_except_trench_tukey(dep,alpha_dip=0.3,alpha_strike=0.3)
taper=leveque_taper*villarroel_taper
# taper=geostochpy.taper_except_trench_tukey(dep,alpha_dip=0.6,alpha_strike=0.4,dip_taperfunc=geostochpy.taper_LeVeque,strike_taperfunc=geostochpy.tukey_window_equal)

mu = geostochpy.matriz_medias_villarroel(media,taper)
# matriz de covarianza
C    = geostochpy.matriz_covarianza_optimized(dip, dep, X_grid, Y_grid,length*1000,width*1000)
# for comcot simulation
Slip=geostochpy.distribucion_slip(C, mu, 20)
Slip,rigidez,Mo_original,Mo_deseado=geostochpy.escalar_magnitud_momento(Mw, Slip, dep, dy*1000, dx*1000,prem=True) # se escala el Slip a la magnitud deseada <--------- Slip final
# Hypocenter=geostochpy.hypocenter(X_grid,Y_grid,dep,length,width) se tiene en cuenta la rigidez con el modelo PREM incluido @fetched with Rockhound

plot_3d(X_grid,Y_grid,-1*dep,Slip)
Total running time of the script: (0 minutes 13.056 seconds)